Combined hydrothermal carbonization with anaerobic digestion: recycling of the HTC products

Roberta Ferrentino1, Fabio Merzari1,2, Luca Fiori1 and Gianni Andreottola1
1Department of Civil, Environmental and Mechanical Engineering, University of Trento, 38123 Trento, Italy. 2CARBOREM S.r.l., 38068 Rovereto, Trento, Italy
Email: roberta.ferrentino@unitn.it | fabio.merzari@carborem.com | luca.fiori@unitn.it | gianni.andreottola@unitn.it
1. Introduction
Anaerobic digestion (AD) offers a means of reducing sludge volumes by 30–50% while producing a gaseous product rich in methane, and pre-treatment processes have been developed to increase the methane yield.
The use of the AD digestate product for soil amendment is challenged by its required quality. This has helped to encourage the development of thermochemical processes harnessing digestate as a feedstock for conversion of its organic content to other useful products, including energy. Thermal processes promote the solubilisation of particulate organic matter and their subsequent prospective biological hydrolytic decomposition by AD.
Hydrothermal carbonization (HTC) is a low-temperature (180–280°C) thermochemical process which generates useful solid (hydrochar) and liquid (HTC liquor) fractions as products. Hydrochar is rich in carbon, and HTC liquor contains fatty acids, soluble proteins, ammonia and phosphorus. These streams may then be both fed to the AD process (Fig. 1).
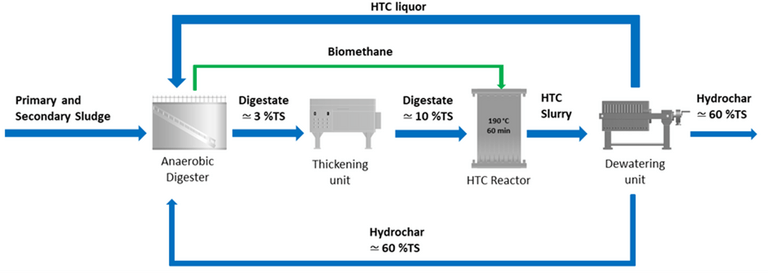
The use of HTC as post-treatment of the AD can:
- save energy, since the thermal energy required by HTC can be applied to a stream more concentrated in solids obtained after thickening;
- reduce the digestate volume, since hydrochar is formed, thus reducing sludge management and disposal costs; and
- improve biogas yield, by recycling the HTC liquor and possibly hydrochar back to the AD.
A study of the impact of returning the HTC liquor and hydrochar on biochemical methane potential (BMP) with and without the hydrochar has been conducted based on primary and secondary sludge samples fed to the AD with downstream thickening. The aim was to establish the proportion of the two streams required to maximize biomethane production.
2. Experimental
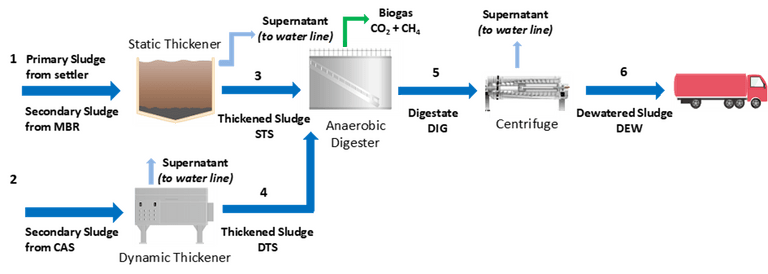
Sludge samples were taken from a full-scale municipal WWTP (Trento, Italy, Fig. 2). Samples of both the blended primary and secondary MBR sludge (Stream 3, STS), and the thickened sludge from a CAS process (Stream 4, DTS) were taken. These streams are both fed to the on-site AD (operating at a 21d SRT and a 33°C temperature), with the digested sludge (Stream 5), DIG, forming the third sample. Polyelectrolyte is added to the DIG prior to centrifugation which generates a 25% TS (total solid) cake (DEW). The AD on site has a capacity of 4850 m3 sludge month−1 based on 75% STS at 2–4.5% TS and 25% DTS at 4–4.5% TS.
The amount of sludge at 10% TS, the assumed concentration of a thickened digestate, was calculated according to:
where:
- γHTC is the HTC influent digestate density (1026 kg m−3)
- TSS and VSS are total and volatile suspended solid concentration in the digestate respectively (kg.m−3), the VSS/TSS ratio being 0.62
- γw, γorg, γashare respectively the density values in kg m−3 for water (1000), the organic matter (1050) and the ash inorganic matter (2500)
- M is the digestate moisture content (90%)
- x is the digestate solid load in kg month−1 (97000, from 967 ton month−1 of sludge at 10% TS) and
- Q is the sludge (STS+DTS) mass flow (m3 month−1).
Since the HTC process generates a 70% solids yield, a 28% liquid yield and a 2% gas yield, and the hydrochar is dewatered to 60% dry matter, the mass balance indicates 113 ton month−1 of 60% TS hydrochar and 852 m3 month−1
HTC process water to be generated. This equates to a ratio of 0.17 between the amount of HTC liquor treated and sludge treated by the AD.
HTC was conducted in duplicate on ~1.5 kg samples at 190 °C and 1 and 3 h reaction times (1-HC and 3-HC respectively). The hydrochar product was collected by gravity filtration and a fraction of it dried at 105°C for 24 h to determine the hydrochar yield (the ratio of the dry solids content of the hydrochar and sludge) and moisture content. The gas yield was computed from the ideal gas law, and the remainder assumed to be the liquid yield.
Bio methane potential (BMP) assays were conducted in triplicate in sealed vessels over 37 days at 35±0.1°C, and performed with a feed/inoculum ratio below 1.0 g COD g COD−1. Results were normalised against the influent COD concentration to provide the specific methane production (SMP). The BMP calculations ignored the COD content of the hydrochar, since it was considered non-biodegradable.
Four different sludges (Table 1) were used for the BMP test programme (Table 2). Test #1 (the 'blank') was based on the inoculum, Test #2 employed inoculum, STS and DTS in a 67:25:8 ratio (the 'reference mix', reflecting the real plant conditions). Test #3 employed the 1-HC HTC liquor and inoculum in a 34:66 ratio, while Test #4 comprised the reference mix and 1-HC HTC liquor in a 95:5 ratio, corresponding to the site-based calculated ratio of HTC liquor to sewage sludge (STS + DTS). Tests #5 to #8 employed increasing proportions of hydrochar added to the reference mix and 1-HC HTC liquor (Table 2).
| Parameter | HTC test | Inoculum | STS | DTS |
|---|---|---|---|---|
| Total Solid TS (%) | 10 ± 2 | 2.5 ± 0.1 | 4.5 ± 0.1 | 4.3 ± 0.1 |
| Volatile Solid VS (%) | 65.0 ± 1.0 | 60.9 ± 1.0 | 80.5 ± 0.1 | 71.8 ± 0.2 |
| Total COD (g TCOD L−1) | 113 ± 6 | 18 ± 1 | 36 ± 2 | 35 ± 2 |
| Soluble COD (g sCOD L−1) | − | 2.2 ± 0.1 | − | − |
| Organic Nitrogen (mg Norg – N L−1) | 5052 ± 252 | 308 ± 15 | 1199 ± 60 | 6398 ± 320 |
| Ammonium Nitrogen (mg NH4+ – N L−1) | 2217 ± 110 | 2041 ± 102 | 316 ± 16 | 492 ± 25 |
| Total Phosphorus (mg TP L−1) | 4373 ± 218 | 488 ± 24 | 380 ± 19 | 1870 ± 94 |
| Test | Inoculum (g) | HTC liquor (g) | STS (g) | DTS (g) | Hydrochar* (g) | Hydrochar/ feedstock** (%) |
|---|---|---|---|---|---|---|
*Hydrochar moisture equal to 87.4% after filtration with filter paper | ||||||
| 1 | 100 | 0 | 0 | 0 | 0 | 0 |
| 2 | 67 | 0 | 25 | 8 | 0 | 0 |
| 3 | 66 | 34 | 0 | 0 | 0 | 0 |
| 4 | 67 | 5 | 21 | 7 | 0 | 0 |
| 5 | 67 | 5 | 21 | 7 | 1 | 3 |
| 6 | 67 | 5 | 21 | 7 | 2 | 6 |
| 7 | 67 | 5 | 21 | 7 | 5 | 15 |
| 8 | 67 | 5 | 21 | 7 | 10 | 30 |
| 9 | 67 | 5 | 21 | 7 | 15 | 45 |
The digestate, the dewatered sludge, the HTC liquor and the inoculum were analysed for TS, VS, NVS, TCOD and sCOD (as well readily biodegradable COD, RBCOD), Norg-N, NH4+-N and TP.
The methane production kinetics was assumed to be represented by the Gompertz and the Cone models, given by:
where:
- G and Gmax respectively are the cumulative and maximum methane production in mL CH4 g−1 COD
- Rmax is the maximum biomethane production rate in mL CH4 g−1 COD d−1
- λ is the lag time
- t is the digestion time in d
- e is a constant (2.72)
- kh is the hydrolysis rate constant (1/d), and
- n is the shape factor.
Gmax, Rmax, λ and kh were determined by non-linear regression.
3. Results and Discussion
The HTC tests results (Table 3) indicated a marginally higher hydrochar yield and lower liquor and gas yield for the 1h treatment time sample. The hydrochar composition indicated no significant difference in the TS and VS contents between the two samples, with up to 40% NVS. Many of the HTC liquor parameters were also largely unaffected by treatment time, with only the RBCOD and the Norg-N content being slightly higher at the shorter treatment time. The longer reaction time therefore had a slightly detrimental effect on composition with respect to its use as an AD feedstock, and the 1-h HTC conditions were used for all subsequent studies.
| Parameter | 1-HTC | 3-HTC |
|---|---|---|
| Hydrochar yield (%) | 72.8 ± 1.4 | 68.0 ± 2.0 |
| Liquor yield (%) | 26.0 ± 1.4 | 30.3 ± 1.3 |
| Gas yield (%) | 1.2 ± 0.0 | 1.7 ± 0.7 |
| Hydrochar | ||
| TS | 98.6 ± 2.0 | 96.6 ± 1.9 |
| VS | 58.6 ± 1.3 | 57.7 ± 3.0 |
| HTC Liquor | ||
| Norg - N (mg Norg - N L−1) | 1531 ± 77 | 1355 ± 68 |
| NH4+-N (g NH4+-N L−1) | 2.7 ± 0.1 | 2.8 ± 0.1 |
| TP (mg TP L−1) | 54 ± 3 | 41 ± 2 |
| TCOD (g TCOD L−1) | 34 ± 2 | 35 ± 2 |
| RBCOD (g RBCOD L−1) | 29 ± 2 | 23 ± 2 |
| TSS (g L−1) | 2.5 ± 0.1 | 1.8 ± 0.1 |
| VSS (%) | 72.7 ± 3.6 | 71.3 ± 3.6 |
| pH | 6.87 ± 0.01 | 7.16 ± 0.01 |
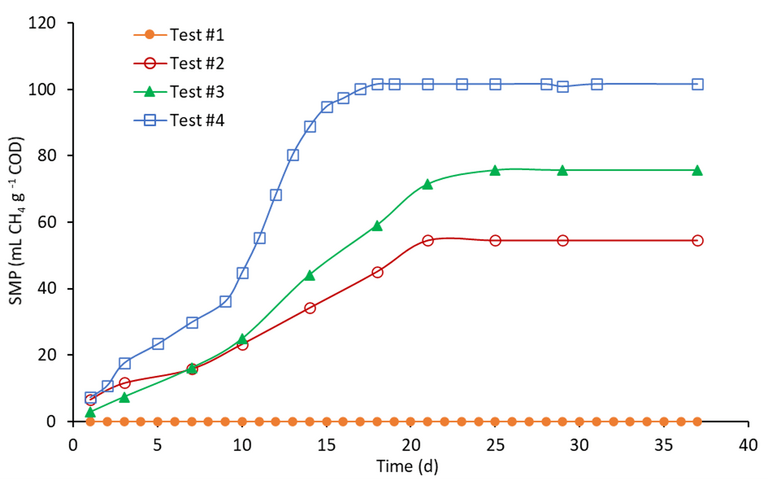
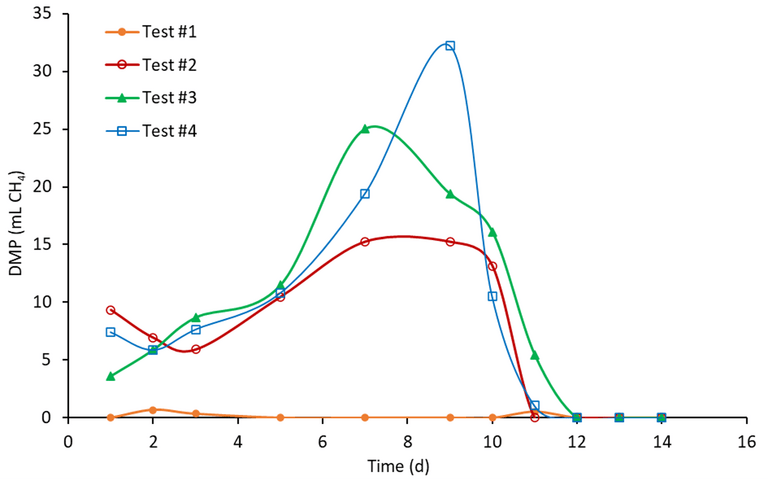
The average SMP trends from the BMP tests indicate the inoculum to generate no methane, since it was pre-incubated for 28 days to minimize the residual biodegradable organic matter (Fig. 3). Against this, the SMP values for the Test #2, Test #3 and Test #4 sludge samples were 55±20, 76±20 and 102±3 mL CH4 g−1 COD respectively, indicating:
- an ~86% enhancement from the partial (15%) replacement of the STS and DTS feed with HTC liquor (Test #4 vs. Test #2)
- a ~39% enhancement from the complete replacement of the STS and DTS feed with HTC liquor (Test #3 vs. Test #2), compared with values between 3 to 227 mL CH4 g−1 COD reported in the literature depending on the feedstock and HTC operating conditions.
The use of the blended HTC liquor/sludge feed also reduced the lag time before the maximum is reached, by almost a week according to the data trends for Test #4 vs Test #2 in Figure 3.
For Tests #5 to #9 where 1−15 g of hydrochar was added to the baseline sludge of Test #4, commensurately increasing the feed COD mass from ~1.2 to a maximum of 1.6 g (Table 2), a corresponding increase in the specific methane production was evident (Fig. 4). The SMP increased from 100±25 to 187±18 mL CH4 g−1 COD on progressively increasing the hydrochar mass from 1 g (3% of the feedstock) to 15 g (45%), with no significant difference between the two highest concentration samples (10 and 15 g hydrochar, 30 and 45% of the total feedstock respectively).
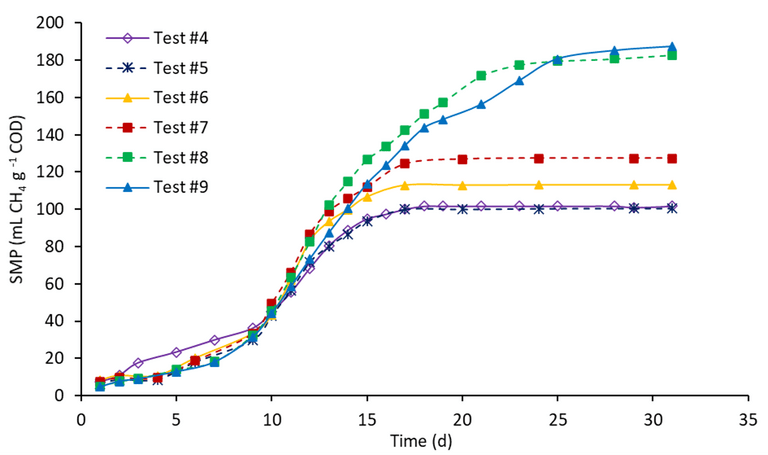
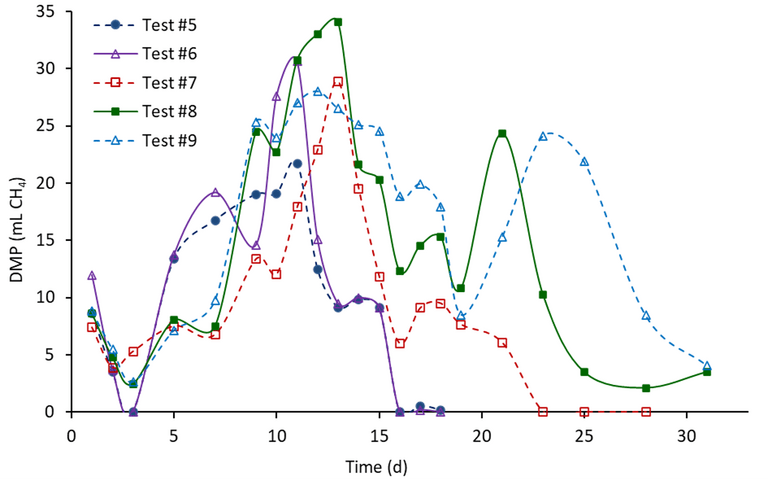
The percentages of CH4 in the biogas were in the range 67–70% across all tests conducted. However, the addition of hydrochar increased the lag time to the maximum daily methane production (DMP) value, by around 8 days.
The DMP indicates a single maximum value reached between 7 and 9 days for Tests #2 to #4 (Fig. 5a), compared to rather more complex trends for samples containing hydrochar (Fig. 5b). Feedstocks containing the higher hydrochar levels led to a second peak after elapsed times which increased with increasing hydrochar content from 18 days (Test #7) to 21 and 23 days for Test #8 and Test #9 respectively. This suggests that the hydrochar organic carbon (i.e. COD content) is actually partly biodegradable.
The cumulative methane production data was fitted to the modified Gompertz and Cone models, (Equations 3 and 4 respectively), with R2 corresponding values of 0.983−0.998 and 0.981−0.999 (Table 4). The trends in computed methane production parameters (Rmax
and Gmax) and lag time (l) follow the empirical trends. The computed hydrolysis rates (kh) were lowest for the sludge-only feed (0.036 d-1, Test #2) and highest for the combined sludge-HTC liquor feed (0.1 d-1, Test #4). The addition of hydrochar caused a slight depression in the kh, from 0.1 down to 0.078 d-1 at the highest hydrochar content.
| GM | GM | GM | GM | CM | CM | |
|---|---|---|---|---|---|---|
GM: Gompertz Model | ||||||
| Test | lambda (d) | Rmax (mL CH4 g−1 COD d−1) | Gmax (mL CH4 g−1 COD) | R2 | kh (d−1) | R2 |
| 2 | 0.3 | 2.6 | 64.6 | 0.990 | 0.036 | 0.981 |
| 3 | 3.7 | 4.4 | 85.3 | 0.997 | 0.070 | 0.995 |
| 4 | 3.5 | 8.6 | 107.6 | 0.983 | 0.100 | 0.986 |
| 5 | 6.5 | 13.3 | 102.8 | 0.994 | 0.096 | 0.996 |
| 6 | 7.3 | 18.3 | 114.9 | 0.994 | 0.095 | 0.995 |
| 7 | 6.9 | 17.3 | 129.4 | 0.996 | 0.093 | 0.997 |
| 8 | 6.9 | 16.1 | 186.2 | 0.998 | 0.078 | 0.999 |
| 9 | 6.9 | 16.2 | 187.9 | 0.998 | 0.078 | 0.998 |
An analysis of the HTC product (Table 5a,b) revealed:
- TCOD removal for Test #4 was >80% higher than for Test #2, suggesting that HTC liquor addition is beneficial to TCOD removal.
- TCOD removals between Tests #3 and #4 were very similar, indicating that blending HTC liquor with sludge does not significantly alter TCOD removal despite the change in SMP.
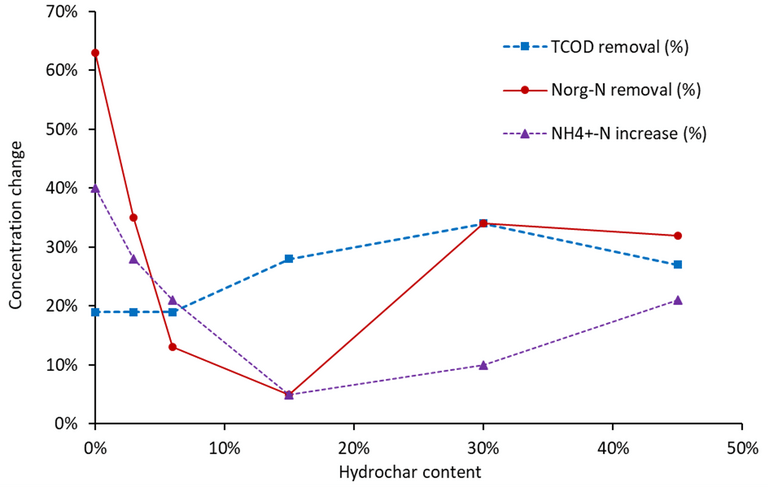
Addition of hydrochar slightly increases TCOD removal, but more significantly affects the fate of N products (Fig. 6) – possibly in part reflecting the impact of the C/N ratio.
| Test |
TCOD0 (gTCOD L−1) |
TCODBMP (gTCOD L−1) |
TCOD removal (%) |
Norg-N,0 (mg Norg-N L−1) |
Norg-N, BMP (mg Norg-N L−1) |
|---|---|---|---|---|---|
| 1 | 18.0 ± 0.9 | 17.9 ± 0.9 | 0.5% | 308 | 284 |
| 2 | 24.6 ± 1.2 | 21.9 ± 1.1 | 11% | 1177 | 594 |
| 3 | 23.8 ± 1.2 | 19.7 ± 1.0 | 17% | 724 | 260 |
| 4 | 24.3 ± 1.2 | 19.6 ± 0.9 | 19% | 844 | 313 |
| 5 | 26.7 ± 1.3 | 21.6 ± 1.3 | 19% | 1151 | 743 |
| 6 | 30.4 ± 1.5 | 24.5 ± 1.4 | 19% | 1215 | 1055 |
| 7 | 25.7 ± 1.3 | 18.6 ± 1.2 | 28% | 958 | 909 |
| 8 | 33.6 ± 1.7 | 22.2 ± 1.4 | 34% | 1480 | 973 |
| 9 | 46.7 ± 2.3 | 33.9 ± 2.2 | 27% | 1518 | 1037 |
| Test |
Norg-N removal (%) |
NH4+-N,0 (mg NH4+-N L−1) |
NH4+-NBMP (mg NH4+-N L−1) |
NH4+-N increase (%) | C/N |
|---|---|---|---|---|---|
| 1 | 8% | 2041 | 2190 | 7% | 7.7 |
| 2 | 50% | 1517 | 1952 | 29% | 9.1 |
| 3 | 64% | 2321 | 3304 | 42% | 7.8 |
| 4 | 63% | 1604 | 2246 | 40% | 9.9 |
| 5 | 35% | 1740 | 2224 | 28% | 9.2 |
| 6 | 13% | 1860 | 2256 | 21% | 10.0 |
| 7 | 5% | 1720 | 1800 | 5% | 9.6 |
| 8 | 34% | 1844 | 2027 | 10% | 10.1 |
| 9 | 32% | 1965 | 2381 | 21% | 13.4 |
4. Conclusions
The study has demonstrated that recycling the product streams from a hydrothermal carbonisation process to the anaerobic digester promotes biogas yield in terms of methane volume per unit feed COD, using HTC process conditions of 190 °C and a 1 h reaction time. The greatest benefit in terms of the specific methane production was obtained by returning both the HTC liquor and hydrochar to the AD, resulting in an 85% increase in yield compared with the reference sludge sample.


